Social Network Analysis Based Metric for Characterizing Behavioral Dynamics of Human-Managed Animals
Tags:
Animal Importance (AIm) by incorporating node- and group-level SNA measures and then use them for characterizing atypical social behaviors of dairy herds in the smart farming sector.
The AIm metric represents the importance of a node (animal) to a social network (group) by considering the variability in group-level structural information, which is computed by joining the node- and group-level SNA measures node centrality (connectivity with its immediate neighbors in a group) and network entropy (characterizes the centrality of the group), respectively. Therefore, the AIm of a node reflects the variation of the herd entropy to respond to the removal of that node from the group. Fig.01 depicts the steps for computing AIm. Moreover, two other metrics, social interaction range and nearest-neighbor (NN) frequency matrix, which represents social affiliation of each node within the group, are computed to alleviate the general challenges such as selecting only the significant interactions in SNA, and thereby, improve the precision of AIm.


Figure 01: Steps for deriving AIm metric; (1)- compute the NN of the node A, (2)- select the NNs in the interaction region, (3)- compute the weighted centrality of A and then the network entropy based on all node centralities, (4)- AIm of the node A is the difference between the network entropies computed with and without A in the network.
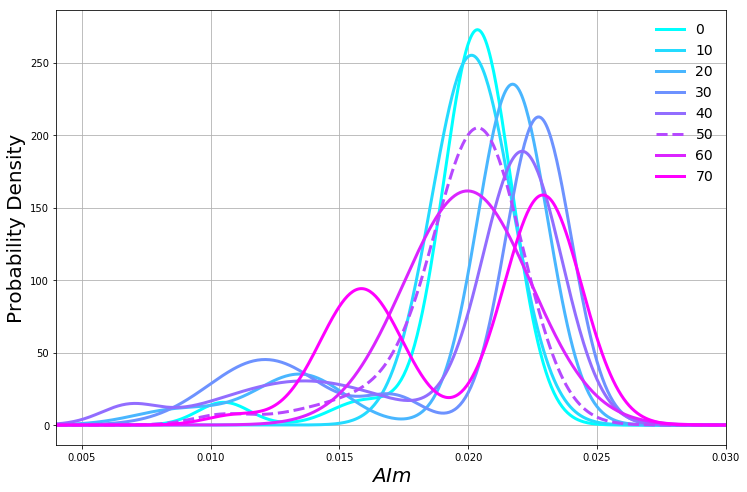
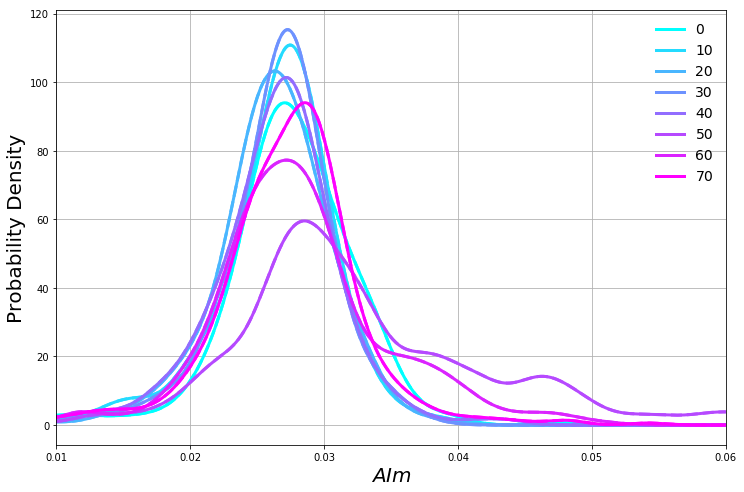
To illustrate the usability of the AIm metric, a study was conducted to identify sick and estrus animals in a dairy herd. Because, generating early alerts for detecting sick animals and animals in estrus is crucially important in dairy farm industry as it helps placing preventive measures in advance and timely insemination for improving, for instance, animal well-being and profit. The joint probability distribution (PDF) of the average AIm of all animals with increasing number of sick (as a percentage of herd size) was computed and exhibited a bi-modal distribution with a left tailored shape, as shown in Fig.02; each line corresponds to the percentage of number of sick animals in the herd. The PDF with cows in estrus was opposite to that of sick cows.


Fig.02: The joint probability distribution of AIm with increasing number (as a percentage of herd size) of sick cows (left) and cows in estrus (right) in a herd.
Publication Title: Leveraging Social Network Analysis for Characterizing Cohesion in Human-managed Animals
Authors: Dixon Vimalajeewa, Sasitharan Balasubramaniam, Bernadette O’Brien, Chamil Kulatunga, Donagh P. Berry
Journal: IEEE Transaction on Computational Social Systems, vol. 6, no. 2, April 2019
]]>


